Step-by-Step: Running Deforum Music Visualizer#
The platform of use is based on that of Deforum Stable Diffusion. It is built on a Google Colab notebook, with the goal of being easy to use and accessible from a resources point of view.
The tool’s structure is split into two interfaces:
Google Colab Notebook: The users mount their Google Drive, essential for saving the produced frames, download and initialize Deforum Stable Diffusion for the text-to-video generation. This part concerns mostly the settings of the text-to-video diffusion model which can be altered to fit user preferences.
Gradio User Interface: Gradio is a tool to host simple and easy-to-use interfaces. An interface is launched inside the notebook and directs users to a different tab, where the main process of the song visualization is handled. This includes URL parsing, MIR, prompt generation, and the visualization process itself.## Step-by-Step: Running Deforum Music Visualizer
Prerequisite: Obtaining and adding Spotify API tokens#
Deforum Music Visualizer utilizes the Spotify API which requires certain user tokens. These tokens are then stored as secrets in the Google Colab notebook to ensure user privacy. To obtain and add the tokens follow these steps:
Get Client ID and Client Secret:
Follow the steps provided here to obtain the spotify client id and spotify client secret.
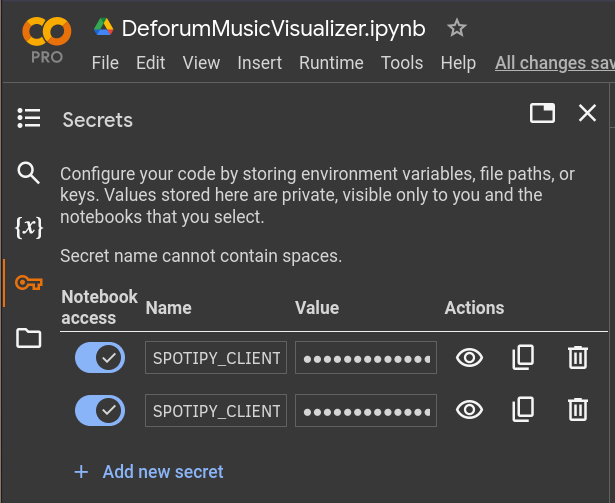
Add the tokens as google colab secrets
Open the google colab notebook and click on
'Secrets'->'Add new secret'options on the top left.Create two secrets with the name
'SPOTIPY_CLIENT_ID'and'SPOTIPY_CLIENT_SECRET'where you should copy the spotify tokens.This will ensure the privacy of the spotify tokens while running the notebook.
Running the Google Colab notebook#
The Google Colab notebook is divided in 3 different sections:
Setup: Sets up the environment for running the model, mounts the users google drive and downloads the required Stable Diffusion models.
Settings: Loads the default or user specified Stable Diffusion model settings. It is recommended for the user to take look into Stable Diffusion Deforum Settings in order to fully utilize this section.
Interface: Launches an independent user interface to accommodate the music visualization process.
Gradio User Interface#
The Gradio interface follows a simple and easy-to-use top-down format:
Provide the
spotify-urlof the track you want to create visuals for.While not required, it is recommended that the user also uploads an audio file of the track to ensure optimal synchronization.
If an audio file is not provided, spotify_dl is used to download the track, but this method may result in lower quality audio, live versions of tracks, unsynchronized visuals, or even the wrong audio track.
Press the
Produce Promptsbutton.This triggers the process of retrieving track information (album cover, duration) and producing default prompts for the visualization.
Final choices.
It is recommended for the user to take time to carefully enhance the default prompts. The prompts will be recycled through the different sections of the song. Any blank prompts will be emmited.
Choose the
durationof the song you want to visualize. Remember, you can always come back and resume previous visualizations.Choose the
fpsrate of the output visual. Higherfpsrate produces smoother output but takes longer to produce.Optional: Choose to resume previous visual. Tick the
resumebox and provide the timestring identifier of the frames you want to resume on, i.e.'20240524113018'. This timestring can be viewed in'AI/StableDiffusion/${YYYY-MM}/${Song_name}', in the name of the frame. It is important to keep the samefpsrate when resuming previous visualizations.
Press the
Visualizebutton.This triggers the visualization process which can take a considerable amount of time. Sit back, drink a cup of coffee and occasionally monitor that everything is running smoothly.
If the gradio cell is run in debug mode you can see the frames produced and the progress in the colab notebook.
Remember, if the runtime gets disconnected or something breaks you can always come back and resume a previous visualization.